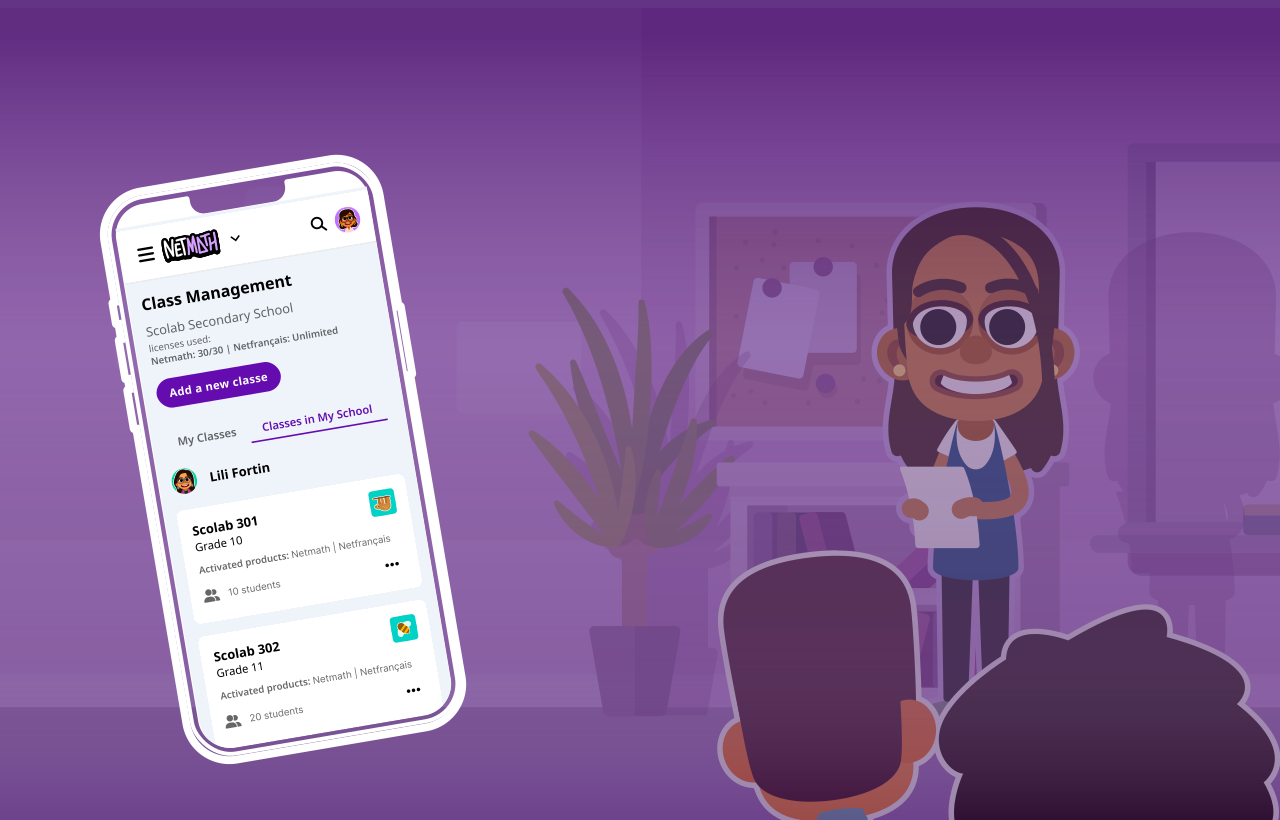

The main challenge of this project was to identify teachers’ priorities and understand what information mattered most to them. Questions such as “What is more important: the student’s learning path, the difficulty level of an activity, or the progress of a collection’s completion across the class?” guided the design process.
These insights led me to create reports with different entry points, tailored to diverse teaching needs.
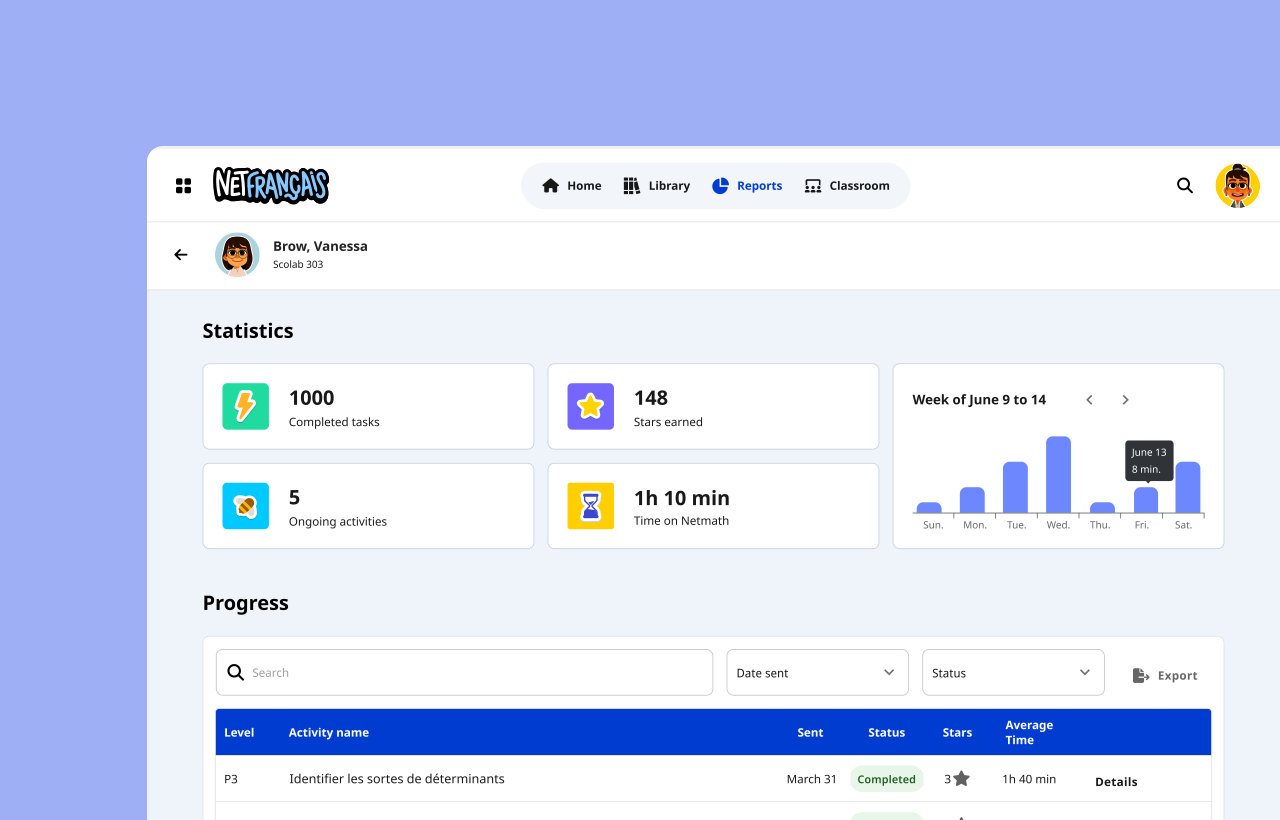
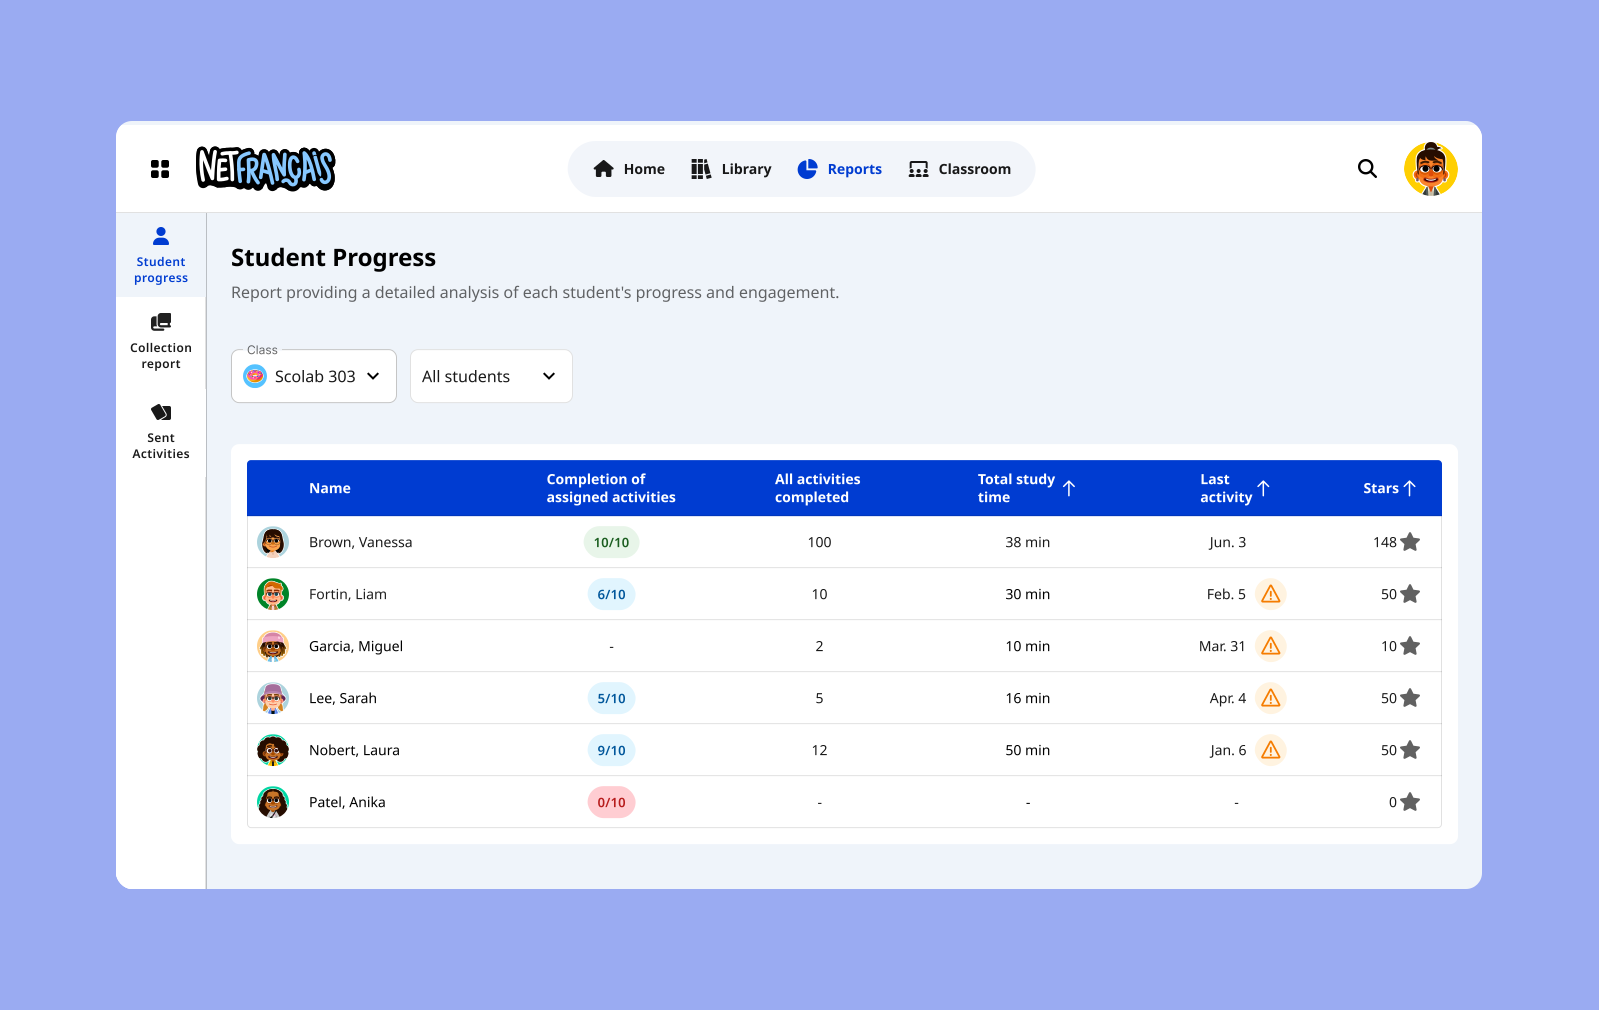
The Student Progress Report was the most important report created to analyze a student’s learning journey. Its primary focus is on the individual student: tracking progress, understanding growth over time, and identifying strengths and weaknesses.
The report’s main screen displays a list of students with key summarized information. When teachers need more detailed insights about a specific student, they can simply click to access the individual report. From there, they can review metrics such as the number of activities in progress or completed, total time spent on tasks, and the specific days the student worked on exercises.

The Shared Collections Report was designed to help teachers monitor the progress of the entire class on a complete collection.
Designed for a broader perspective, this report allows teachers to monitor the entire class’s progress on a shared collection. It includes metrics such as completion rates, average time per activity, and accumulated stars (a gamified metric that accounts for repeated attempts). Teachers can also navigate seamlessly to Detailed Activity Report for deeper analysis.


The Sent Activities Report helps teachers track how students perform on specific tasks they’ve assigned.
At a glance, it shows which activities are more challenging for the class by highlighting completion rates and average time spent. It also identifies which teacher sent the activity (useful when a class has multiple instructors).

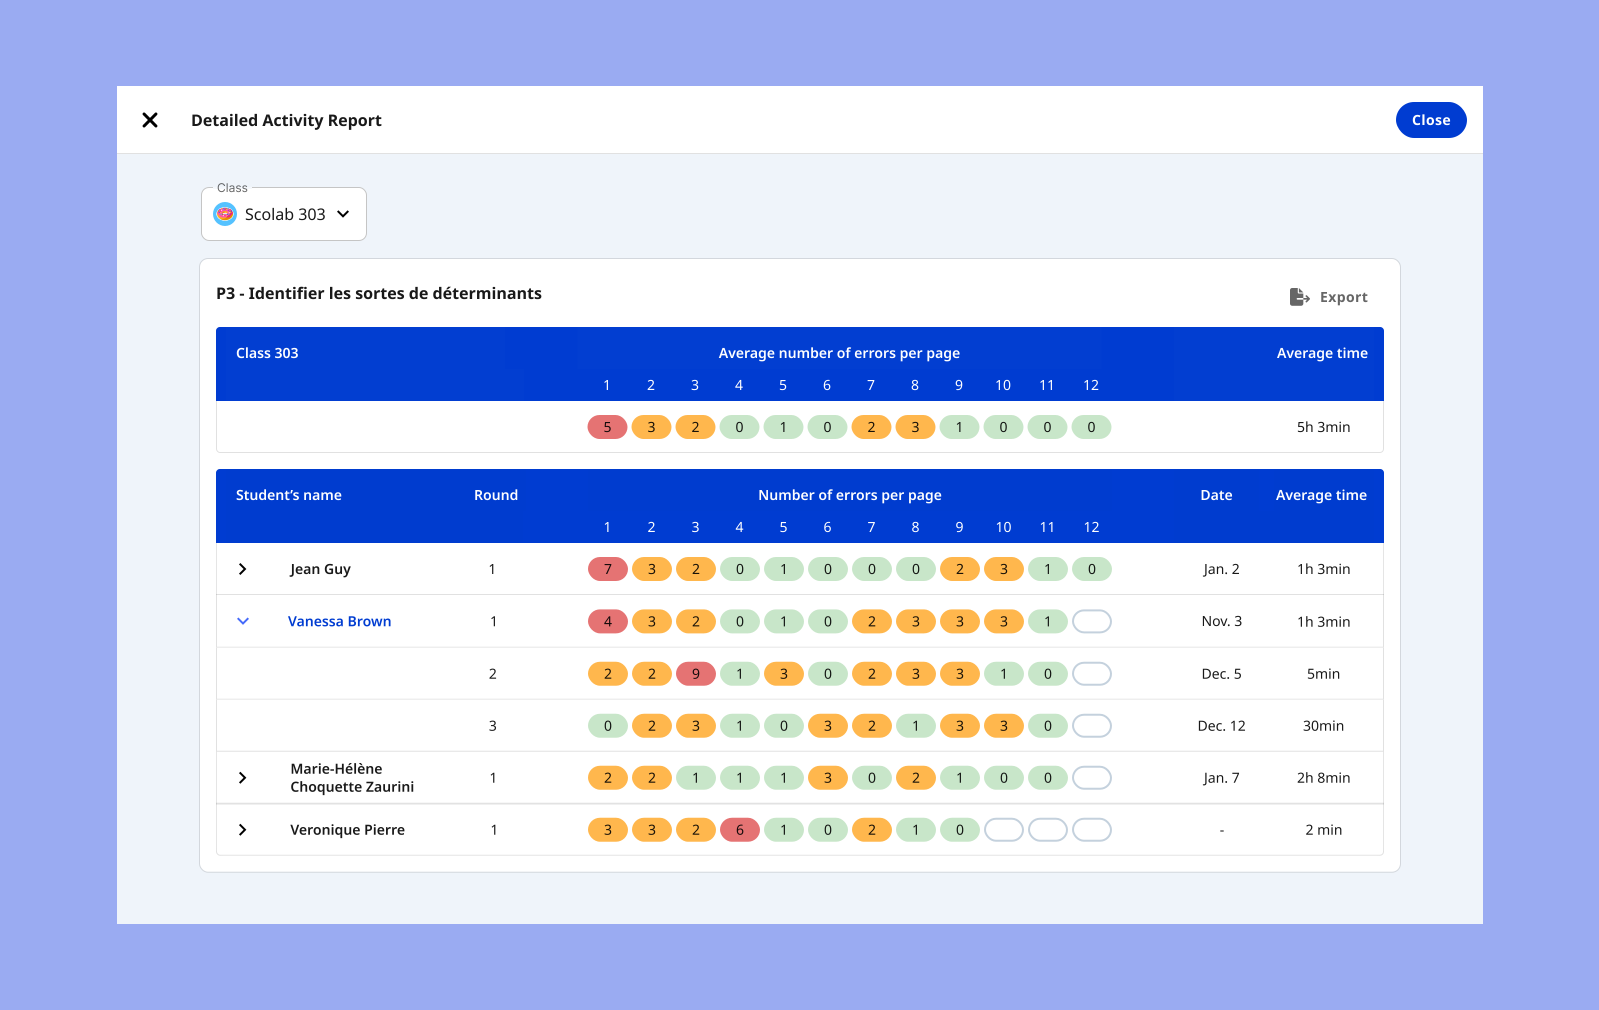
The Detailed Activity Report gives teachers a deeper view of a student’s challenges with a specific task. It not only shows the number of mistakes made but also pinpoints the exact pages where those errors occurred.
The report also tracks how many attempts the student made and how their performance improved with each retry.
The Reports Redesign Project was a key initiative that also served as a sales strategy to attract new clients to Netfrançais. It enables teachers to accurately track students’ learning paths and progress, assess the difficulty level of activities, and monitor the overall progress of an entire class within a collection.
In general, the new reports allow teachers to view the same activity from four different perspectives. Additionally, the redesigned reports are now three times more functional than the original ones. Previously, only the Sent Activities Report was widely used by teachers, as the other reports did not provide relevant information.
Next projects.
(2025-26©)